🚀 Quick Verdict
The AI infographic generator builds a coherent structure from a single prompt. It doesn’t just throw icons on a page; it groups data logically. We found the chart editor much easier to use than spreadsheets for simple reporting.
| Overall Score | 8.2/10 |
| Best For | Marketing teams and educators |
| Tested Plan | Pro Plan ($14/mo) |
| Testing Period | 14 days |
| Biggest Strength | Clean data visualization |
| Biggest Weakness | Strict free project limits |
| Best Alternative | Canva |
🤔 What Is Piktochart?
Piktochart is a web-based design tool built specifically for people who need to communicate data. It focuses on infographics, reports, and presentations rather than just social media posts. The platform helps non-designers turn messy numbers into clear visual stories.
The company started in 2011 and has grown into a staple for internal business communication. It solves the problem of “death by bullet points” by providing templates that prioritize information hierarchy. It’s now used by millions of people to create everything from HR newsletters to pitch decks.
⚙️ How We Tested Piktochart
We signed up for the Pro plan at $14 per month and used it for two weeks. Our testing involved three specific founder tasks: generating a 5-step process infographic from a text prompt, creating a quarterly report with three custom charts, and extracting brand colors from our website URL.
✨ Key Features (What Actually Stood Out)
Piktochart feels more like a reporting tool than a general art canvas. It’s built for users in a design workflow where data accuracy matters as much as aesthetics.
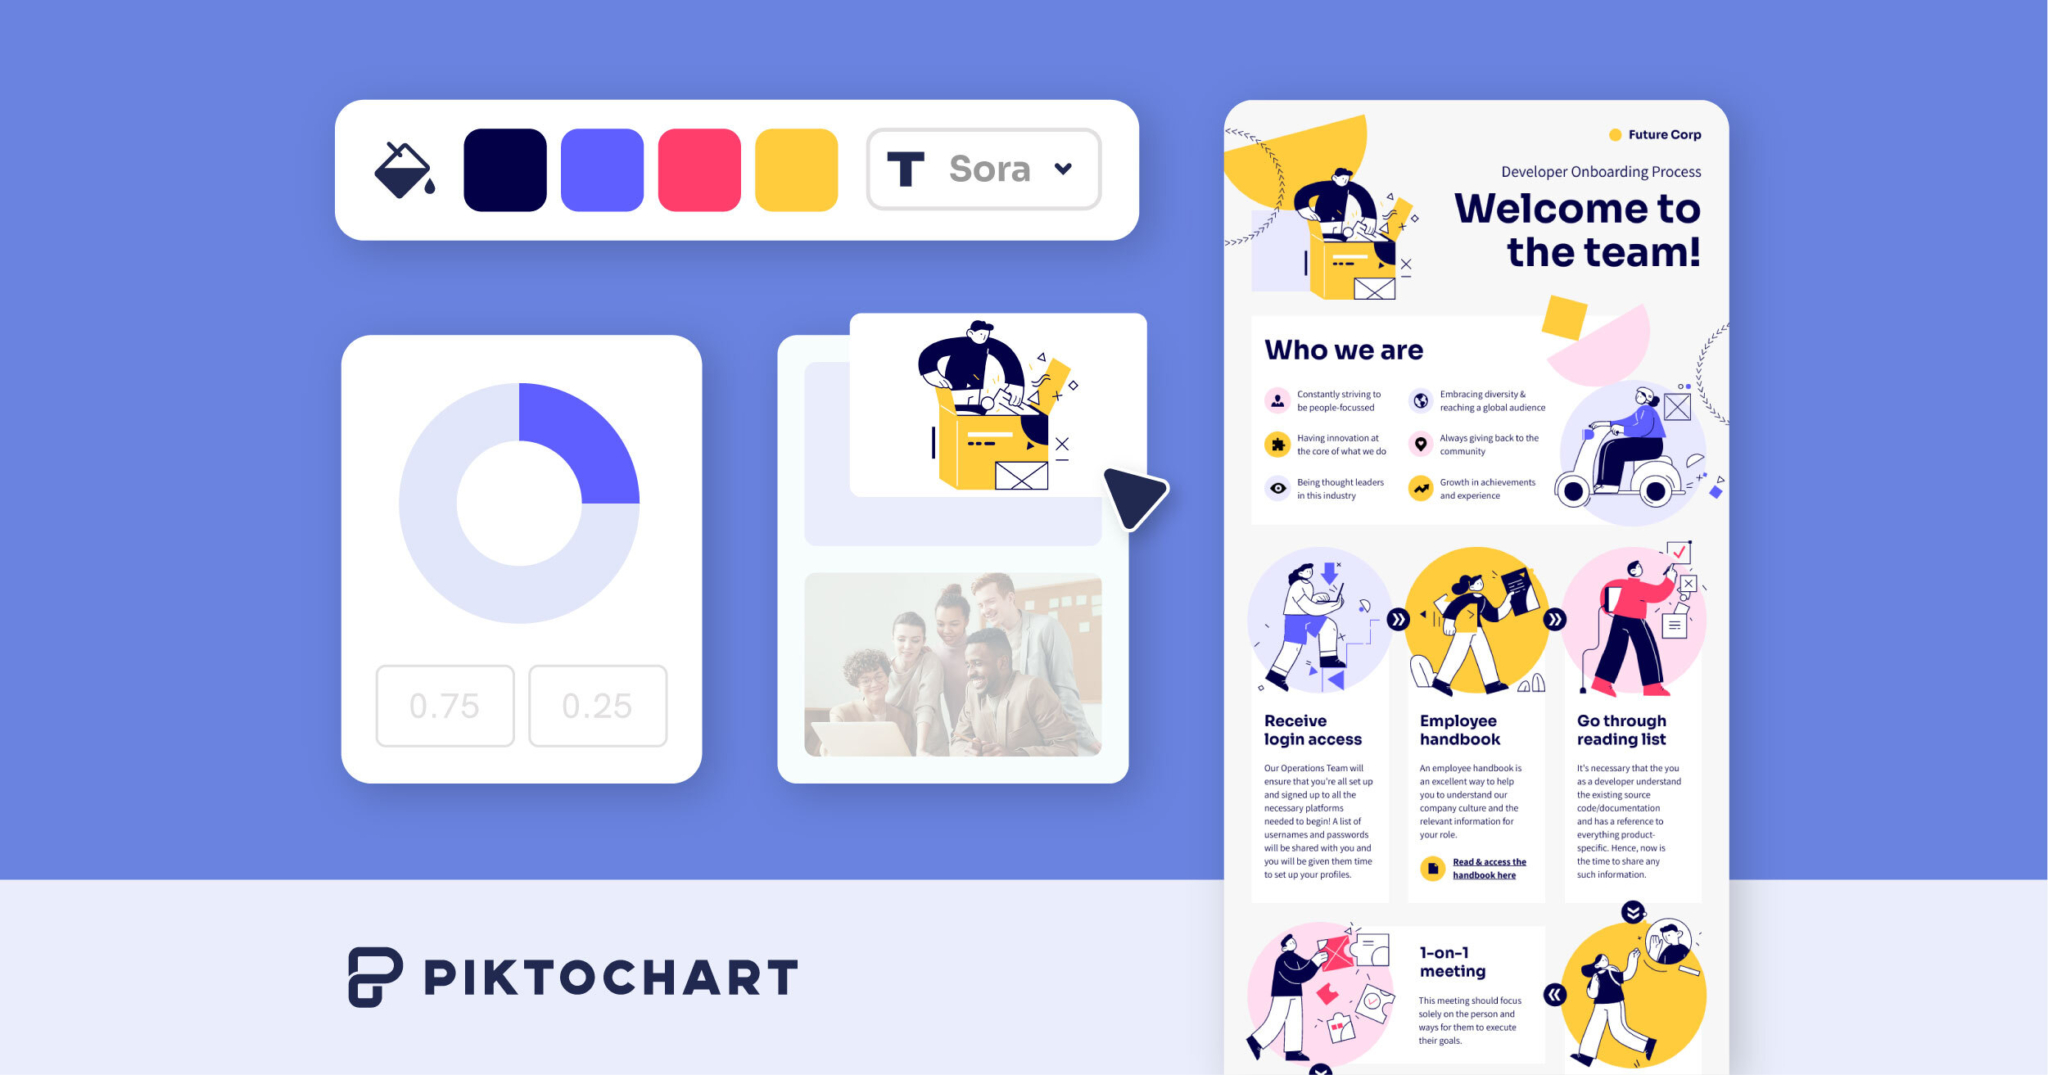
- AI Infographic Generator — We entered a single topic and it produced a full layout with relevant headers and icons. It didn’t get the data 100% right, but it saved an hour of layout work.
- Brand Asset Extraction — You can paste your website link and it pulls your logo and color palette. This kept our reports consistent with our site without manual hex code entry.
- Interactive Maps — We used this to visualize regional sales data. The maps are easy to color-code by simply clicking on specific countries or states.
- Chart Maker — You can import data directly from Google Sheets. The charts update automatically when you change the source numbers, which is great for recurring reports.
- Video Snippets — This feature turns long recordings into short clips for social media. It works well for repurposing webinars into LinkedIn content.
💰 Piktochart Pricing — Is It Worth It?
The pricing is competitive for small teams, but the free plan is very restrictive. You’ll hit the project limit quickly if you use it for daily marketing tasks. Most of the high-quality export options are locked behind the paid tier.
| Plan | Price | Best For | Watch Out For |
| Free | $0 | Occasional users | 5 project limit |
| Pro | $14/mo | Small businesses | 100GB storage cap |
| Enterprise | Custom | Large teams | Requires sales call |
Our pick: Pro — This plan removes the project limit and gives you the high-resolution PDF exports you need for professional presentations.
🧪 What We Found During Testing
The interface doesn’t feel cluttered like some other design tools. When we tried to create a chart, the data entry window popped up clearly and didn’t crash even with larger datasets. We were surprised by how well the brand color extractor worked; it even picked up the secondary accent colors from our footer.
A founder in our community who runs a consulting firm told us they stopped hiring freelancers for slide decks because the templates look professional enough for enterprise clients.
⚠️ Limitations We Found
- Project Limits — As of late 2024, the free plan only allows 5 active projects. You have to delete old work to start something new.
- Export Restrictions — You can’t download high-quality PDFs or PowerPoint files on the free plan. This makes the free version mostly for testing, not for final delivery.
- AI Credit System — The AI generation uses credits. Once you run out, you have to wait for a reset or upgrade, which can stall your workflow.
⚔️ Piktochart vs Competitors
Most people compare this tool to general design platforms that offer a wider range of social media assets.
| Competitor | Pick it instead of Piktochart if… |
| Canva | You need a massive library of stock photos and social media templates. |
| Venngage | You are creating highly technical data visualizations for scientific papers. |
| Visme | You want advanced animation and interactive elements for web-based decks. |
👍 Pros & Cons
| ✅ Pros | ❌ Cons |
| Fast data-to-chart conversion | 5-project limit on free plan |
| Clean business-focused templates | AI credits are capped monthly |
| Automatic brand color extraction | Some templates feel a bit dated |
| No watermarks on free infographics | High-res exports require payment |
🎯 Who Should Use Piktochart (And Who Shouldn’t)
✅ Use it if you:
- Need to turn Excel data into professional charts quickly.
- Are a non-designer who needs to build reports for stakeholders.
- Want to maintain brand consistency across a small team.
❌ Skip it if you:
- Need a tool primarily for Instagram or TikTok content — use Canva instead.
- Require heavy photo editing or complex vector illustration.
- Are looking for a totally free tool with unlimited project storage.
❓ Frequently Asked Questions
Is Piktochart completely free?
There’s a free plan that allows up to 5 active projects, but high-resolution downloads are locked behind paid tiers.
Can I use Piktochart for presentations?
Yes, it has a specific presentation mode and templates designed for pitch decks and internal reports.
Does Piktochart have AI features?
It includes an AI infographic generator that builds layouts from text prompts and an AI image generator.
Can I export to PowerPoint?
Yes, but the ability to download your projects as PPT files is a feature of the Pro plan.
Is it better than Canva for infographics?
Piktochart is often better for data-heavy infographics, while Canva is better for general social media graphics.
Does the free plan have watermarks?
Unlike many competitors, Piktochart does not put watermarks on your designs even on the free plan.
Looking for more tools like this? See all design tools we’ve reviewed →
Discover more from AI Founder Kit
Subscribe to get the latest posts sent to your email.