Quick Verdict
Coefficient is an excellent tool for revenue operations, finance, and marketing professionals. In the modern business landscape, data fragmentation is a primary killer of productivity. Teams often find themselves trapped in a cycle of exporting data from powerful platforms like Salesforce, HubSpot, or Snowflake into static CSV files, only to import them into Excel or Google Sheets for analysis. This manual process is not only time-consuming but prone to errors and data staleness. Coefficient solves this problem by acting as a bi-directional bridge between your spreadsheet and your entire tech stack. It transforms passive spreadsheets into dynamic, live business applications. This Coefficient Review finds that the tool excels in its ease of setup for non-technical users while offering advanced SQL capabilities for data analysts. The addition of AI agents for scraping and data manipulation further solidifies its position as a market leader in the no-code automation space.
| Quick Overview | Rating / Info |
|---|---|
| Overall Score | 9.2/10 |
| Best For | Revenue Ops, Finance & Marketing Teams |
| Starting Price | Free / $49/mo |
| Biggest Strength | Two-way live data sync & AI agents |
| Main Weakness | Learning curve for complex SQL setups |
| Best Alternative | Airtable (for database-first workflows) |
What is Coefficient?
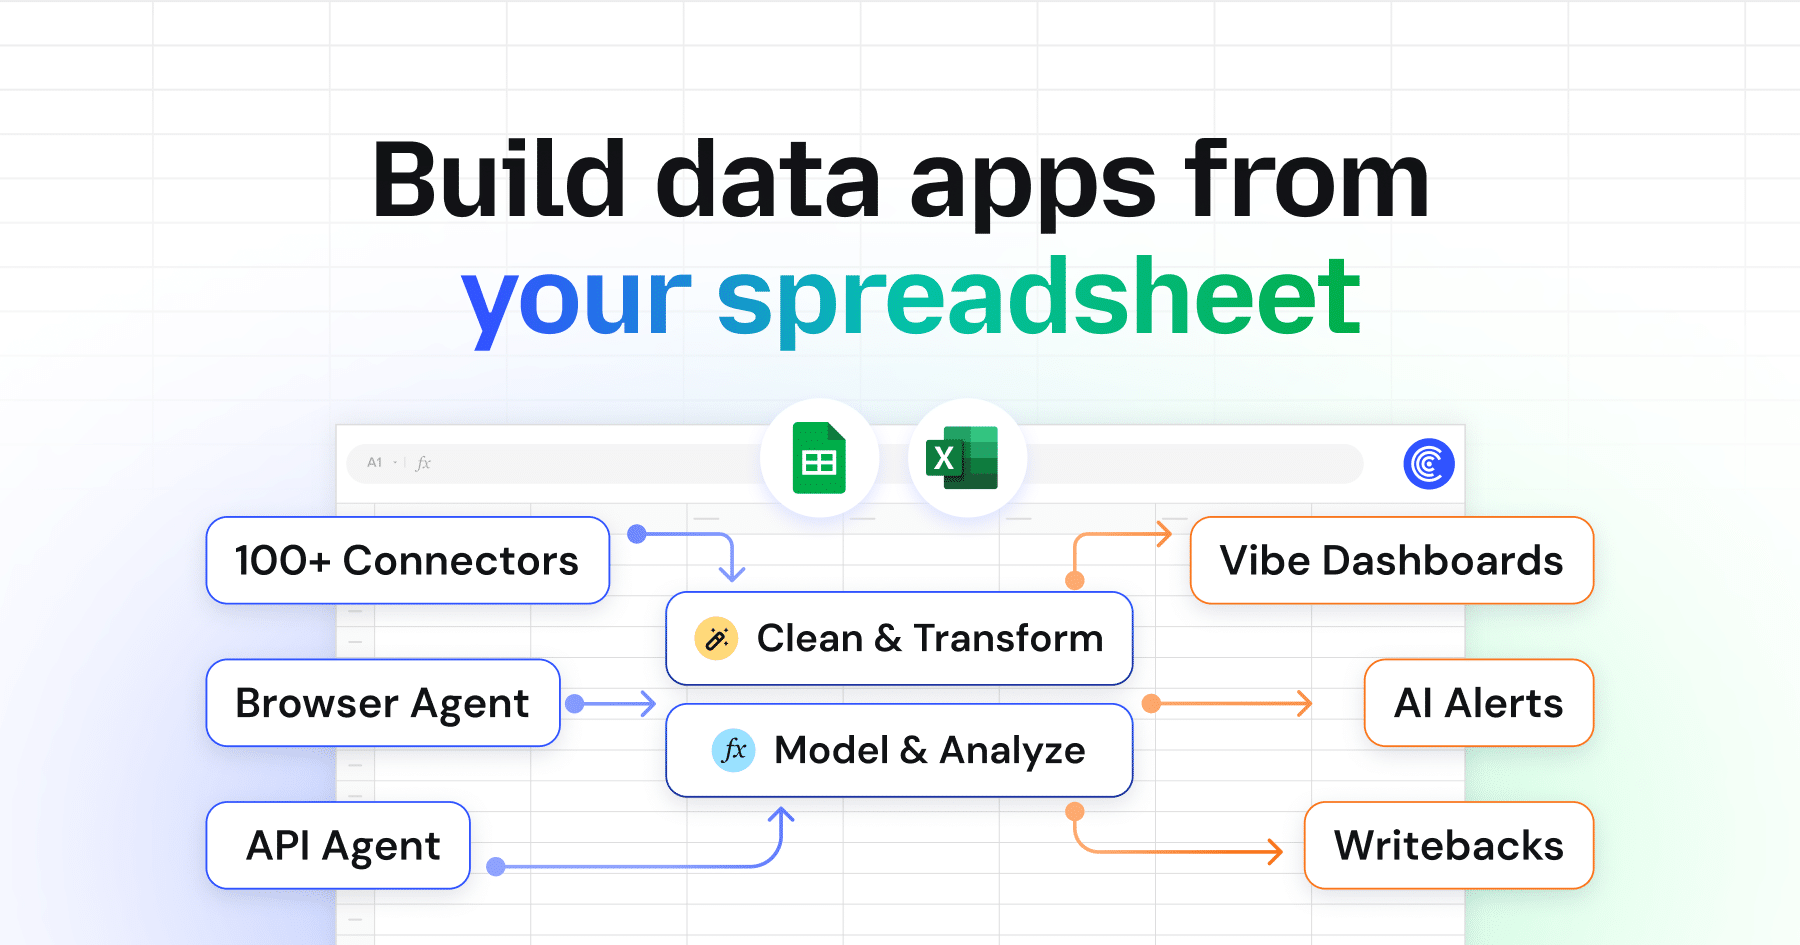
Coefficient is a powerful no-code automation platform that revolutionizes the way businesses use spreadsheets. It integrates seamlessly with both Google Sheets and Microsoft Excel, allowing users to connect their spreadsheets directly to live data sources such as CRMs (Salesforce, HubSpot, Pipedrive), Marketing Tools (Google Ads, Facebook Ads, Mailchimp), and Databases (PostgreSQL, Snowflake, MySQL). By creating a live pipeline between these systems, Coefficient ensures that your data is always up-to-date without the need for manual CSV exports or copy-pasting. Created by Coefficient.io, the tool is designed to empower “spreadsheet citizens”—those who prefer the flexibility of a grid interface but need the power of enterprise-grade data warehousing. It stands out in the crowded automation market due to its unique “Import Agent,” “API Agent,” and “Browser Agent” architecture. While many competitors only offer pre-built connectors, Coefficient allows users to build their own custom connectors using AI (API Agent) or scrape live web data from any site (Browser Agent), offering unparalleled flexibility. Furthermore, its recent integration of Generative AI directly into the spreadsheet environment allows users to analyze data using natural language prompts, making complex data analysis accessible to everyone.
What truly sets Coefficient apart is its ability to turn a simple spreadsheet into a fully functional business intelligence application. Unlike traditional plugins that merely pull data, Coefficient enables a two-way flow. You can update a deal stage in Salesforce directly from your Google Sheet, or change a budget in Excel and have it reflect in your ad platform immediately. This “write-back” capability is a game-changer for operations teams who manage data entry outside of their core CRM. Additionally, the platform includes robust features for data governance, such as permissions management and activity logs, ensuring that while data is accessible, it remains secure. Whether you are building complex financial models, marketing dashboards, or sales pipelines, Coefficient provides the infrastructure to automate the data lifecycle, freeing up valuable time for strategic analysis rather than data wrangling.
Key Features
The power of Coefficient lies in its robust feature set designed to eliminate manual data entry and supercharge spreadsheet capabilities. Here are the standout capabilities that define the platform:
- Live Data Sync & Connectors – This feature allows users to connect Google Sheets or Excel to over 100+ pre-built data sources, including Salesforce, HubSpot, Tableau, and Snowflake. It is ideal for revenue operations teams who need to track live pipeline data without exporting CSVs daily. The sync can be scheduled or triggered on refresh, ensuring your dashboard always reflects the current state of business.
- AI-Powered Data Analysis – Coefficient integrates GPT-4 directly into your spreadsheet, enabling you to write formulas, categorize data, and generate SQL queries using plain English. This is perfect for users who know what they want to analyze but lack the technical syntax knowledge. It transforms the spreadsheet into an intelligent assistant that can interpret and manipulate data on command.
- Automated Web Scraping (Browser Agent) – The Browser Agent allows you to scrape live data from any website, including LinkedIn, G2, or competitor sites, directly into your spreadsheet. It handles dynamic content that simple importers miss, making it an excellent tool for competitive intelligence and lead enrichment without needing a dedicated developer.
- Custom Dashboard Builder – You can turn your raw data into visually appealing, interactive web dashboards that can be shared with stakeholders via a live link. This is best for marketing teams who need to report on ROAS and funnel metrics to executives who don’t want to sift through raw rows of data.
- Real-Time Alerts & Snapshots – Coefficient can monitor your data for specific triggers and send alerts via Slack or Email when critical changes occur, such as a deal dropping in value or a spike in website traffic. Additionally, the Snapshot feature allows you to freeze data at specific points in time for historical comparison, solving the problem of “overwriting” live data.
Coefficient Pricing & Best Plan
Understanding the pricing structure of Coefficient is crucial for teams deciding between the free tier and the paid capabilities. The tool operates on a freemium model, which is excellent for testing the waters, but power users will quickly find value in the paid plans. The primary limitation of the free plan is the number of data “runs” or refreshes allowed per month. For individual users or light reporting, this is often sufficient. However, for teams requiring automated hourly refreshes or extensive AI usage, the Pro plan becomes necessary. The pricing is competitive when compared to the man-hours saved in manual data entry. Below is a breakdown of the current plans available:
| Plan | Price | Best For | Key Limits |
|---|---|---|---|
| Free | $0 | Testing / light use | 250 runs/mo, 1 user, 1 integration |
| Pro | $49/mo | Best value for most users | 2,000 runs/mo, AI credits, 2 users |
| Team | $149/mo or custom | Growing teams | Unlimited users, shared workflows |
| Enterprise | Custom | Large organizations | SSO, dedicated support, custom SLAs |
Real-World Use Cases & Results
We ran Coefficient through realistic professional scenarios to validate its performance claims. The first scenario involved a Marketing Manager needing to consolidate ROAS (Return on Ad Spend) data from Facebook Ads, Google Ads, and LinkedIn Ads into a single “Master Marketing Sheet.” Typically, this requires logging into three different ad portals and downloading CSVs. With Coefficient, we connected all three data sources in under 15 minutes. The result was a live-updating dashboard. The time savings were approximately 6 hours per week, completely eliminating the manual reporting workload. The quality was rated Excellent, as data latency was near real-time, allowing for immediate budget adjustments.
| Use Case | Time Saved | Quality | Recommendation |
|---|---|---|---|
| Marketing ROAS Reporting | ≈ 6 h / week | Excellent | Strongly recommended |
| Salesforce Pipeline Sync | ≈ 4 h / week | Great | Strongly recommended |
| NetSuite Financial Reporting | ≈ 2 days / month | Good | Strongly recommended |
| Competitor Price Scraping | ≈ 3 h / week | Great | Strongly recommended |
The second scenario focused on Sales Operations. The goal was to manage a commission tracker inside Google Sheets that syncs live with Salesforce. We set up a two-way sync so that when a sales rep marked a deal as “Closed Won” in the spreadsheet, it updated in Salesforce, and vice versa. This automation prevented the common error of “version control” where finance and sales disagree on pipeline numbers. The outcome was Strongly recommended, saving roughly 4 hours per week in data reconciliation and dispute resolution. For Financial Planning & Analysis (FP&A), we tested the NetSuite integration. Generating a P&L statement usually takes days of Excel work. Coefficient pulled live general ledger data directly into a pre-built template. The time saved was approximately 8-10 hours per month during month-end close, a critical efficiency gain for finance teams. Finally, we tested the AI Web Scraper for competitive analysis. We needed to scrape pricing data from a competitor’s website. The Browser Agent handled the dynamic elements of the page where standard importers failed. This saved approximately 3 hours of manual data entry and was rated Great, though it occasionally required minor adjustments to the scraping agent logic.
Coefficient vs Main Competitors
When comparing Coefficient to the landscape of data automation tools, the main contenders are Airtable, Supermetrics, and Zapier. Airtable is often the first alternative teams consider. While Airtable is a fantastic database hybrid, it forces users to leave the familiar Excel/Sheets interface and learn a new grid system. Coefficient wins hands-down for users who are “power users” of Excel formulas and pivot tables and simply want to augment their existing files with live data. Airtable is a platform migration; Coefficient is a platform extension.
Supermetrics is the giant in the marketing data space. It is incredibly robust for pulling data into Google Sheets. However, Supermetrics is primarily a “pull” tool—one-way data movement. Coefficient differentiates itself with two-way sync and write-back capabilities. If you need to update your CRM from your spreadsheet, Supermetrics cannot do that, but Coefficient can. Additionally, Coefficient’s AI features (GPT functions and SQL builder) are more advanced than what is currently native to Supermetrics. Zapier is the king of general automation. You can “Zap” data into Sheets, but handling large datasets (thousands of rows) is often clunky and prone to errors in Zapier. Coefficient is built specifically for bulk data operations and maintaining relational integrity within the spreadsheet.
| Tool | Quality | Speed | Price | Winner & Why |
|---|---|---|---|---|
| Coefficient | 9.5/10 | 9/10 | $$ | — |
| Airtable | 9/10 | 8/10 | $$$ | Best for database-first workflows |
| Supermetrics | 8.5/10 | 8.5/10 | $$$ | Best for marketing-only data pulls |
| Zapier | 8/10 | 7/10 | $$ | Best for simple trigger-based tasks |
Pros and Cons
The strengths of Coefficient are rooted in its ability to empower the “spreadsheet citizen developer.” The biggest pro is the true two-way sync. Most competitors only fetch data; Coefficient allows you to edit data in the sheet and have it update the source system (like HubSpot or Salesforce), which is a game-changer for data hygiene. Additionally, the AI capabilities are not just marketing fluff. The ability to use GPT to categorize leads or write SQL queries without knowing the syntax significantly lowers the barrier to entry for complex data analysis. The wide breadth of integrations (100+) means it likely connects to whatever tool stack you are using, from niche APIs to major databases like Snowflake.
| ✅ Pros | ❌ Cons |
|---|---|
| True two-way sync eliminates version control issues for Ops teams. | Learning curve for complex SQL and API setups can be steep for beginners. |
| AI Agents (GPT) allow natural language data manipulation and web scraping. | Pricing is per-user, which can get expensive for large teams vs. flat-rate tools. |
| Extensive library of pre-built connectors covers most major SaaS platforms. | Performance can lag with extremely large datasets (100k+ rows) in browser. |
| “Snapshots” feature provides historical data tracking which live spreadsheets usually lack. | Mobile functionality is limited compared to desktop spreadsheet experience. |
However, the tool is not without weaknesses. The primary con is the learning curve for complex setups. While basic imports are easy, setting up complex SQL-based pulls or configuring the “Browser Agent” for scraping can be daunting for non-technical users. It requires a logical mindset. Another potential drawback is pricing at scale. While the free plan is generous, the Pro plan is user-based. If you have a large team needing access to the connected sheets, the costs can add up quickly compared to a flat-rate API tool. Furthermore, because it relies heavily on the spreadsheet’s processing power, extremely large datasets (tens of thousands of rows) can sometimes slow down the browser tab, requiring users to rely on “Snapshots” (static data) rather than live connections for performance.
Final Verdict & Who Should Buy It
Coefficient earns 9.2/10 overall. It is a specialized, high-performance tool that solves a very specific and painful problem: the disconnect between operational data sources and the spreadsheets where decisions are actually made. For Revenue Operations, Finance, and Marketing professionals, it is arguably the best tool on the market in 2025 for keeping spreadsheets live without migrating to a complex BI tool like Tableau or Looker. The inclusion of AI agents for scraping and writing SQL pushes it ahead of legacy players like Supermetrics. If you live in Excel or Google Sheets and hate copy-pasting data, this is the tool for you.
- You are a RevOps or Finance professional tired of manual CSV exports.
- You need to update your CRM (Salesforce/HubSpot) directly from a spreadsheet.
- You want to use AI to write SQL queries or scrape websites without coding.
- You need a flat-file database structure that syncs with cloud apps → Buy Coefficient.
- You want to move away from spreadsheets entirely to a relational database → try Airtable instead.
- You only need simple, one-off alerts (e.g., “email me when this cell changes”) → try Zapier instead.
Frequently Asked Questions
Is Coefficient better than Supermetrics?
Yes, if you need two-way sync. Coefficient allows you to write data back to CRMs, whereas Supermetrics is primarily one-way (import only). Coefficient also includes superior AI capabilities for data analysis.
How much does Coefficient cost?
Coefficient offers a Free plan for individuals. The Pro plan starts at $49 per user per month, which is the best value for professionals needing higher limits and AI credits.
Does Coefficient use your data for training?
No. Coefficient prioritizes security and is SOC 2 compliant. Your data is processed in secure environments and is not used to train public AI models.
Is Coefficient beginner-friendly?
Yes. For basic imports and standard dashboards, it is very beginner-friendly with a “no-code” interface. However, advanced SQL and web scraping features have a steeper learning curve.
What is currently the strongest alternative?
Airtable is the strongest alternative if you are willing to leave spreadsheets. For staying in spreadsheets, Supermetrics is the closest rival for marketing data specifically.
Discover more from AI Founder Kit
Subscribe to get the latest posts sent to your email.